TradingKey - On August 31 Eastern Time, shares of Tesla (TSLA) rose over 4%, reclaiming the $360 mark.
Recently, the Trump administration moved to control the power supply chain on national security grounds. Last Wednesday, Tesla officially signed an emergency executive order, prohibiting the U.S. power grid from procuring and installing foreign-manufactured transformers, core power equipment, and supporting software that pose security risks, while leaving policy leeway for subsequent restrictions on existing installed equipment and authorizing the Department of Energy to gradually implement the measures based on actual circumstances.
From the perspective of the energy landscape, China accounts for approximately 80% of global battery and solar inverter capacity, and the U.S. has also imported dozens of large transformers manufactured overseas over the past decade. With high reliance on foreign power supply chains, this ban is essentially a supply chain localization effort in the energy infrastructure sector.
This ban is expected to drive structural revenue growth for domestic U.S. energy equipment manufacturers.
Financial results show that in the second quarter of fiscal year 2026, revenue for Tesla's Energy Generation and Storage segment (which includes solar and battery storage systems) grew 13% year-over-year to $3.14 billion.
Analysts believe the policy will prioritize the localization of U.S. energy infrastructure, and Tesla, leveraging its Megapack utility-scale energy storage system and solar business layout, is expected to benefit from this supply chain restructuring.
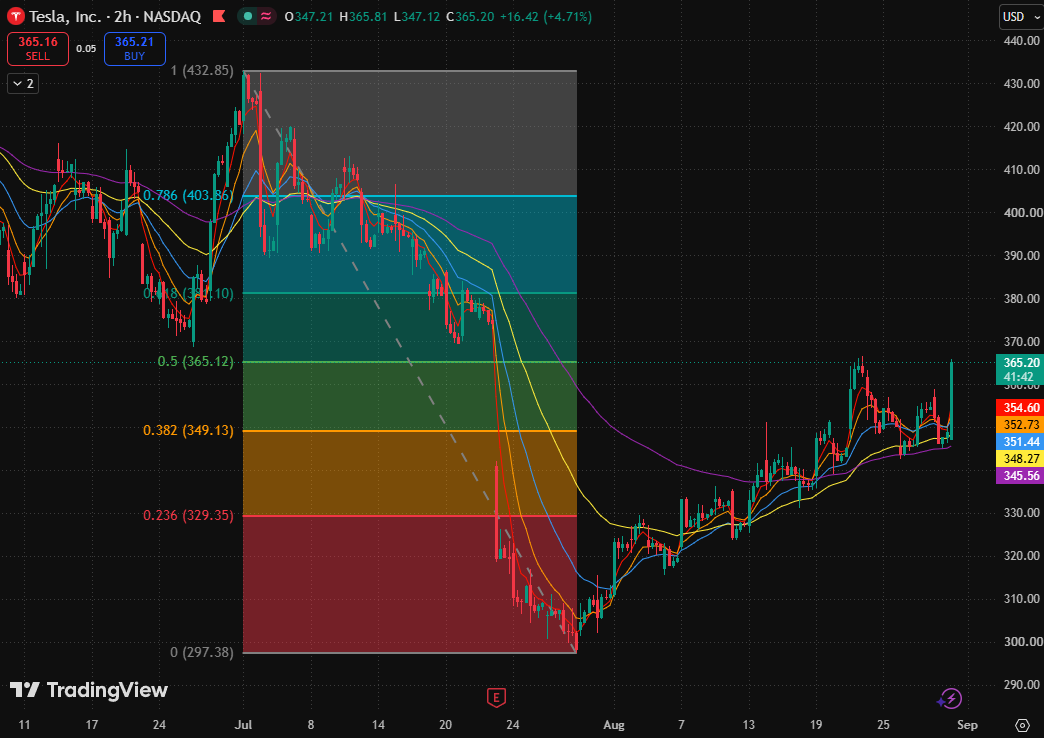
Tesla two-hour stock chart, Source: TradingView
Looking at Tesla's stock chart, the price previously pulled back after surging near $365, but the retracement did not break below the support zone formed by the 20-day, 80-day, and 160-day moving averages. Recently, it tested the 0.5 Fibonacci retracement level ($365.12) upward again, indicating that short-term buyers remain in control.
The 5-day moving average is located above the other moving averages, and all five moving averages are below the current price, reflecting that the short-term trend has recovered from a previous decline to a relatively strong stance.
On the bullish side, if the stock price can effectively break above $365.12 and hold this level during a pullback, the next upside target to watch is the 0.618 Fibonacci retracement level ($381.10); if $381.10 is also effectively broken, room for a rebound could open up toward the 0.786 Fibonacci retracement level ($403.85).
On the bearish side, if the stock price faces resistance again near the 0.5 Fibonacci retracement level ($365.12), this rally may turn back into high-level consolidation within the range of $349.13 to $365.12.
Find out more