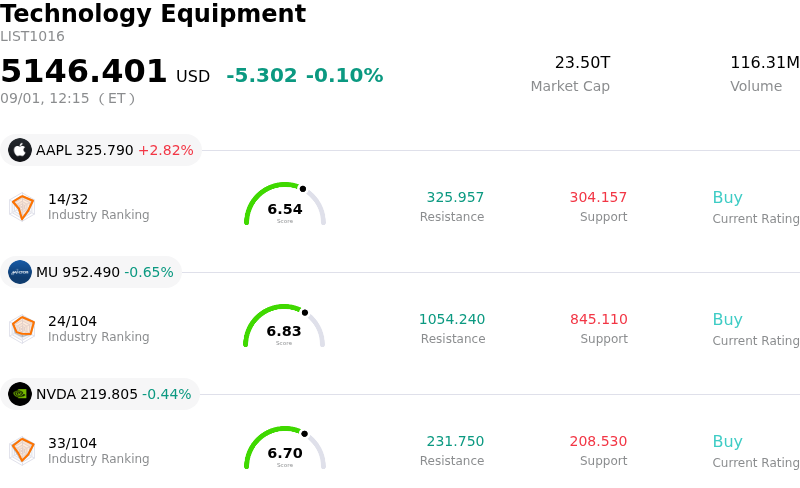
Texas Instruments Inc (TXN) moved down by 3.00%. The Technology Equipment sector is down by 0.10%. The company underperformed the industry. Top 3 stocks by turnover in the sector: Apple Inc (AAPL) up 2.82%; Micron Technology Inc (MU) down 0.65%; NVIDIA Corp (NVDA) down 0.44%.
What is driving Texas Instruments Inc (TXN)’s stock price down today?
Texas Instruments experienced downside pressure and heightened intraday volatility as a broader tech-led market pullback unfolded. A sharp surge in long-term benchmark Treasury yields weighed heavily on technology equities, driving institutional investors to trim exposure across rate-sensitive growth names. Rising bond yields increase discount rates applied to future cash flows, creating immediate valuation headwinds for chipmakers and putting the broader technology sector under noticeable selling pressure.
The pull-back in Texas Instruments also reflects wider sector-specific dynamics across the semiconductor landscape. Semiconductor indices saw pronounced weakness as market participants re-evaluated multi-year valuations against broader macroeconomic uncertainties, including elevated energy prices and persistent inflation concerns. While long-term demand drivers in automotive and industrial analog markets remain intact following recent quarterly operational improvements, short-term risk aversion led traders to lock in gains across chip holdings.
Company-specific factors also played a role in shaping investor sentiment during the session. Investors continue to scrutinize the company's capital expenditures dedicated to internal manufacturing expansion alongside its pending acquisition obligations. While these strategic investments position the firm favorably for long-term domestic manufacturing advantages, the required capital intensity makes the balance sheet more sensitive during periods of broader market stress. Additionally, recent corporate disclosures detailing executive option exercises and open-market share sales added to short-term caution, contributing to intraday price swings.
Technical Analysis of Texas Instruments Inc (TXN)
Technically, Texas Instruments Inc (TXN) shows a MACD (12,26,9) value of -1.880, indicating a sell signal. The RSI at 35.942 suggests neutral condition and the Williams %R at 96.101 suggests oversold condition. Please monitor closely.
Media Coverage of Texas Instruments Inc (TXN)
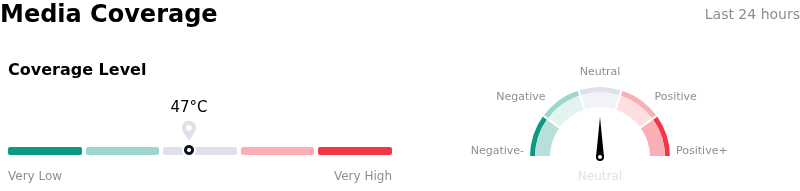
In terms of media coverage, Texas Instruments Inc (TXN) shows a coverage score of 47, indicating a moderate level of media attention. The overall market sentiment index is currently in neutral zone.
Fundamental Analysis of Texas Instruments Inc (TXN)
Texas Instruments Inc (TXN) is in the Technology Equipment industry. Its latest annual revenue is $17.68B, ranking 14 in the industry. The net profit is $4.97B, ranking 10 in the industry. Company Profile
Over the past month, multiple analysts have rated the company as Buy, with an average price target of $309.53, a high of $400.00, and a low of $184.59.
More details about Texas Instruments Inc (TXN)
Company Specific Risks:
- Subdued Guidance & Delayed Revenue Realization: Management's quarterly revenue outlook missed consensus expectations due to a delay in realizing top-line benefits from recent price increases, creating near-term earnings execution risks.
- Elevated Capital Expenditure & Margin Drag: Heavy long-term capital allocation toward 300mm manufacturing capacity expansion alongside elevated inventory levels continues to weigh on free cash flow generation and cap gross margin expansion relative to peers.
- Valuation Multiple Compression Exposure: Trading at a high forward P/E multiple relative to broader analog semiconductor peers, the stock remains highly susceptible to intraday sell-offs if end-market acceleration in industrial and data center segments moderates.
- Reduced Share Buyback Velocity & Insider Sales: Form 4 disclosures highlighting recent executive stock sales, coupled with a 61% year-over-year reduction in trailing 12-month share repurchases, reduce corporate liquidity support for the stock during market pullbacks.
Find out more